文件下载地址:PorcupinePlot
Step 1:
获得 extreme1.pdb 使用如下命令
|
|
Step2:
使用文本编辑器,从extreme1.pdb保存第一个frame 改成”first_frame.pdb”
相似的把最后一个frame改为 “last_frame.pdb”
Step3:
打开VMD, Load first_frame.pdb in New Molecule.
相似的load, last frame 作为 a newmolecule.
Step4:
打开 Tcl/Tk Console
Step5:
输入”play Porcupine.tcl“ 并回车
Step6:
然后在 VMD(主界面) Main, 点击 first_frame 并且在 console 中输入: atomselect top “name CA”
step7:
Then in VMD Main, click on last_frame and type in console: atomselect top “name CA”
Step8:
然后输入
|
|
最后的输入结果类似如下:
|
|
在VMD中最终效果如下:
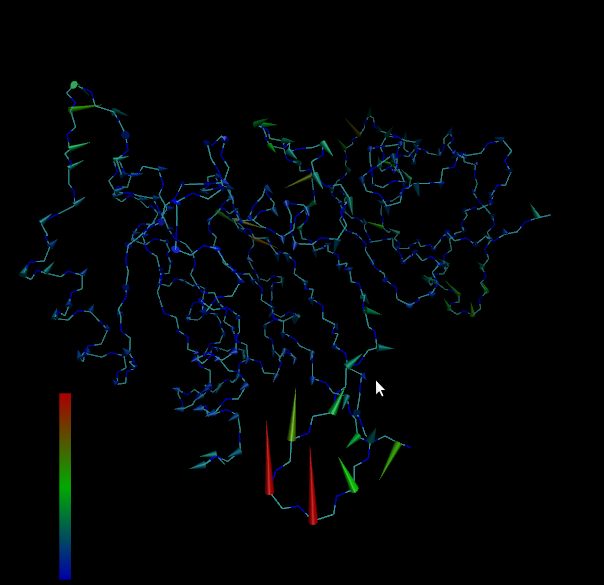
Demo_ras-raf
注意:在 g_covar 和 g_anaeig 命令中选择protein而非Ca
感谢GROMACS小组-李辉指正